Client-Side Overlays for Digital Pathology
Client-Side Overlays for Digital Pathology
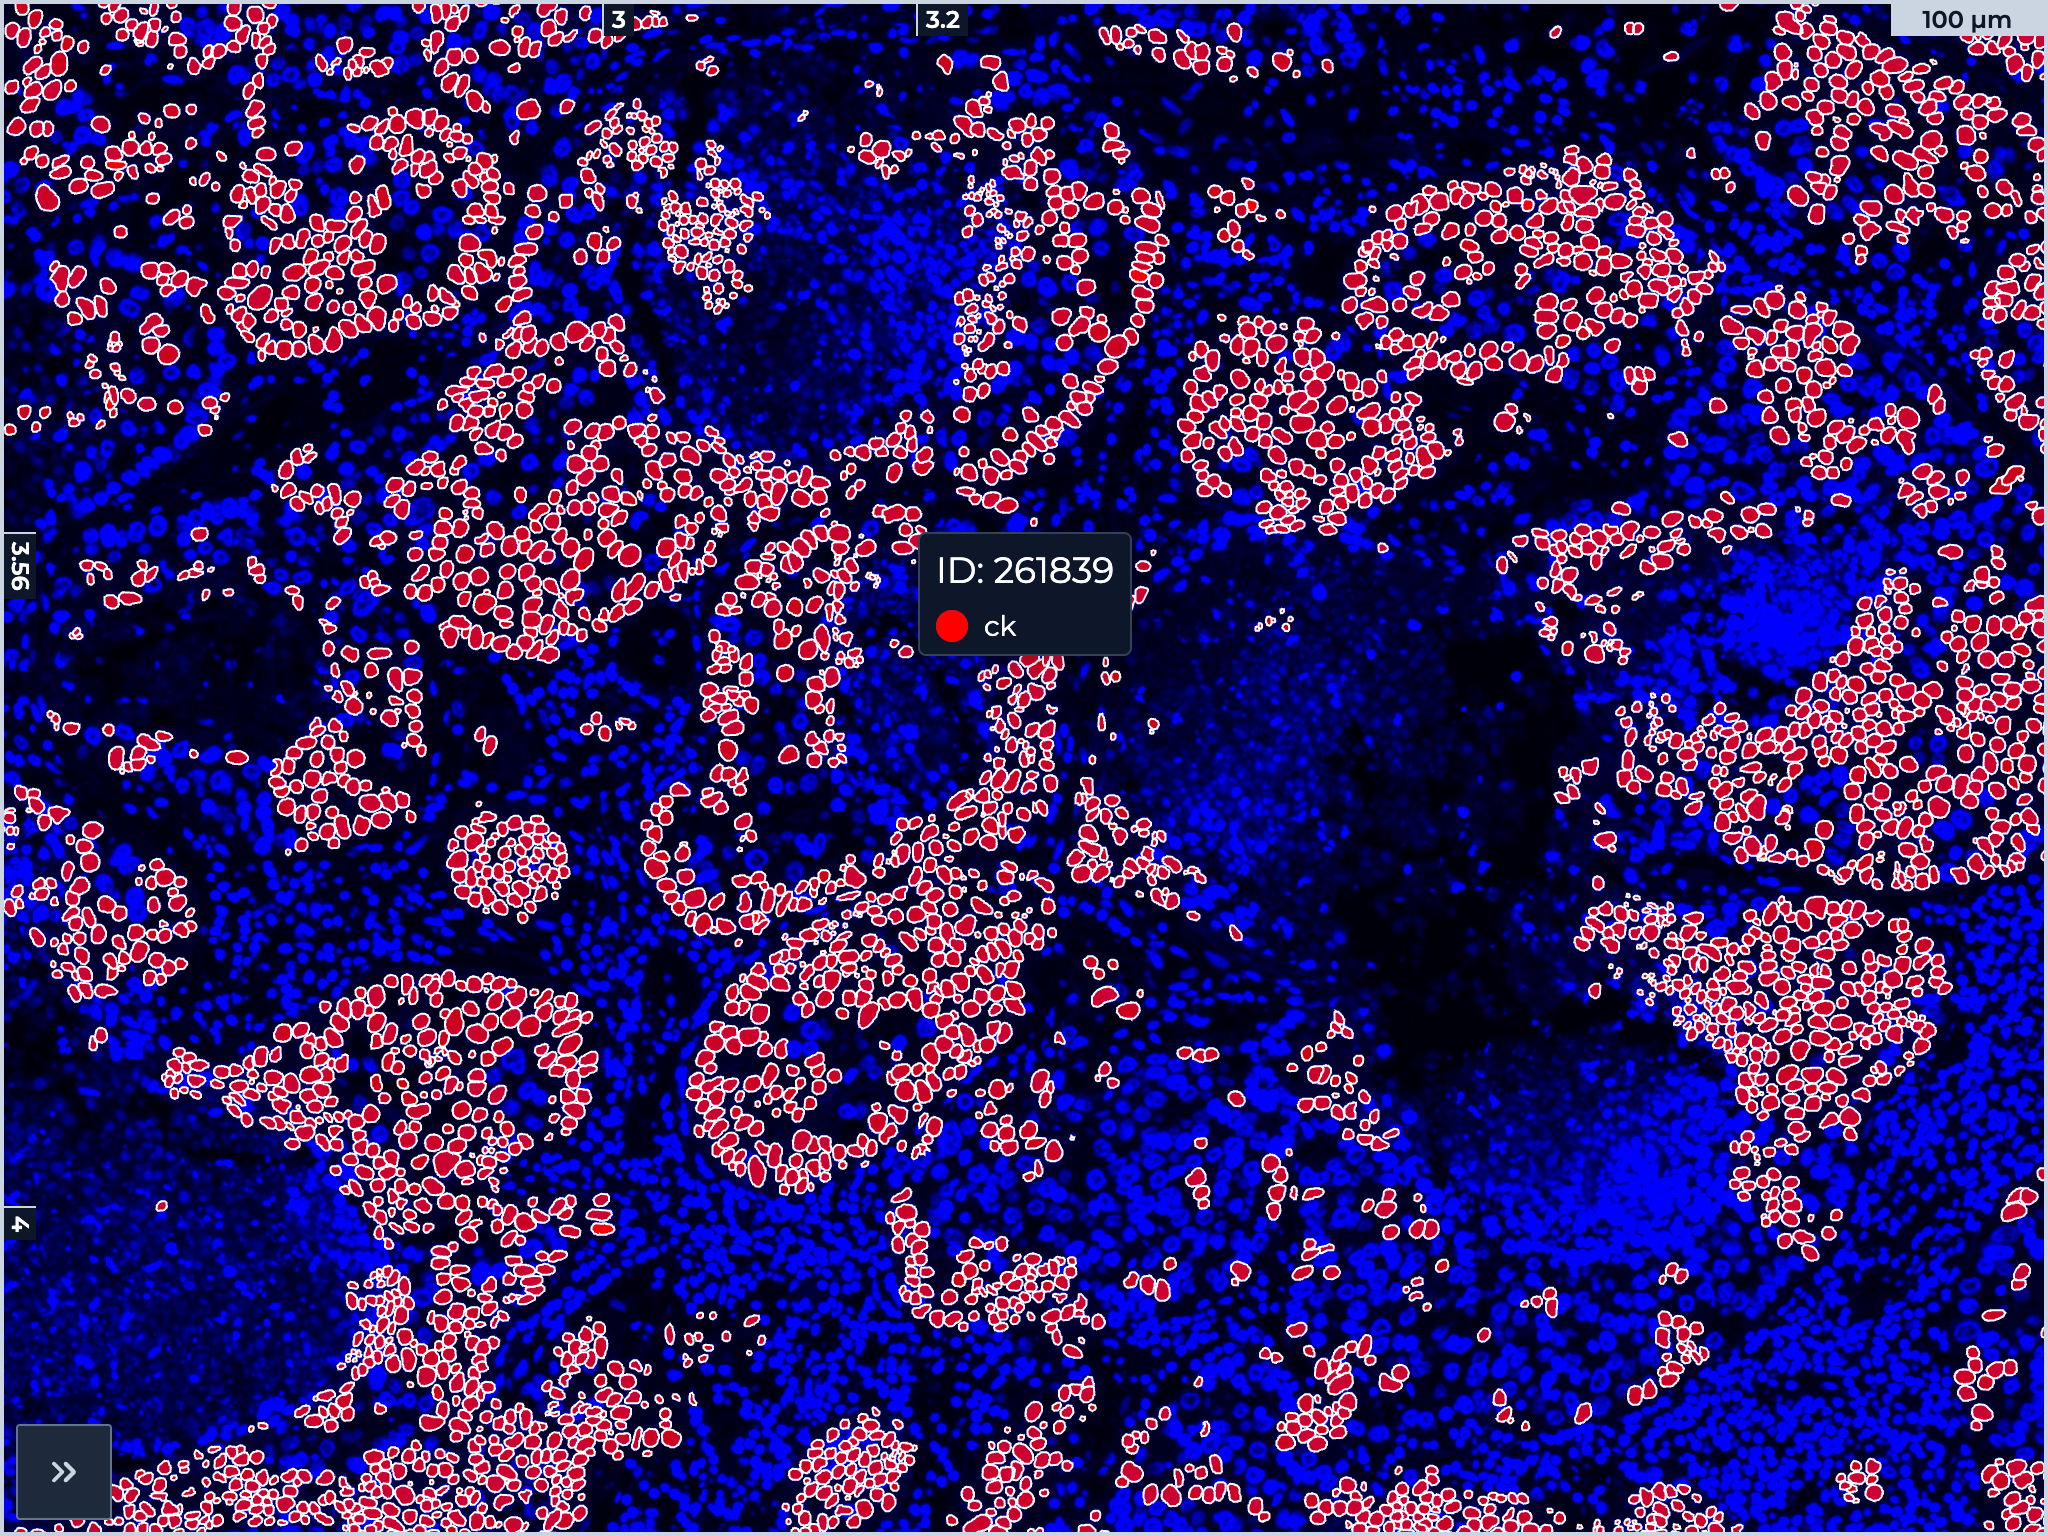
Overlay performance in tissue image viewers is often frustrating. Toggle a marker: wait for a server round-trip. Adjust opacity: the browser freezes while JavaScript redraws thousands of SVG elements. Pan across the tissue: choppy and disorienting.
This is not about poor implementation. Many of these tools come from excellent engineering teams. The problem is architectural—both on the server and in the browser—and it is solvable.
The Architecture Challenge
Most visualization platforms follow one of two approaches:
The Database Approach: Cell geometries are stored in PostGIS or similar and queried on demand. This works until you have hundreds of datasets and need to iterate on analysis. Each iteration becomes: run Python analysis, import results into the database, repeat. A quick computation turns into a lengthy round-trip. At scale, out-of-memory crashes during ingestion become a fundamental challenge.
The Binary Format Approach: Pre-convert data into optimized proprietary formats. Fast rendering, but every iteration requires a lengthy format conversion, resulting in another waiting game.
Both approaches share the same flaw: an opaque layer between your data and your visualization. Whether it is a tile server, a database, or a conversion pipeline—you are locked into infrastructure that does not speak the same language as your analysis tools.
The cytario Approach
What if the browser could query your data files directly, right where they sit in S3?
Plain Parquet Files
Your data stays as standard Parquet files. Columns for x, y, and your marker data.
| |
The file your Python scripts read is the same file the viewer renders. No conversion, no import, no schema migration. When your analysis pipeline generates new results, they are immediately visible in the viewer.
Browser Queries S3 Directly
We use DuckDB-WASM—an analytical database compiled to WebAssembly that runs entirely in the browser.
When you pan to a new region, your browser executes a SQL query directly against the Parquet file in S3:
| |
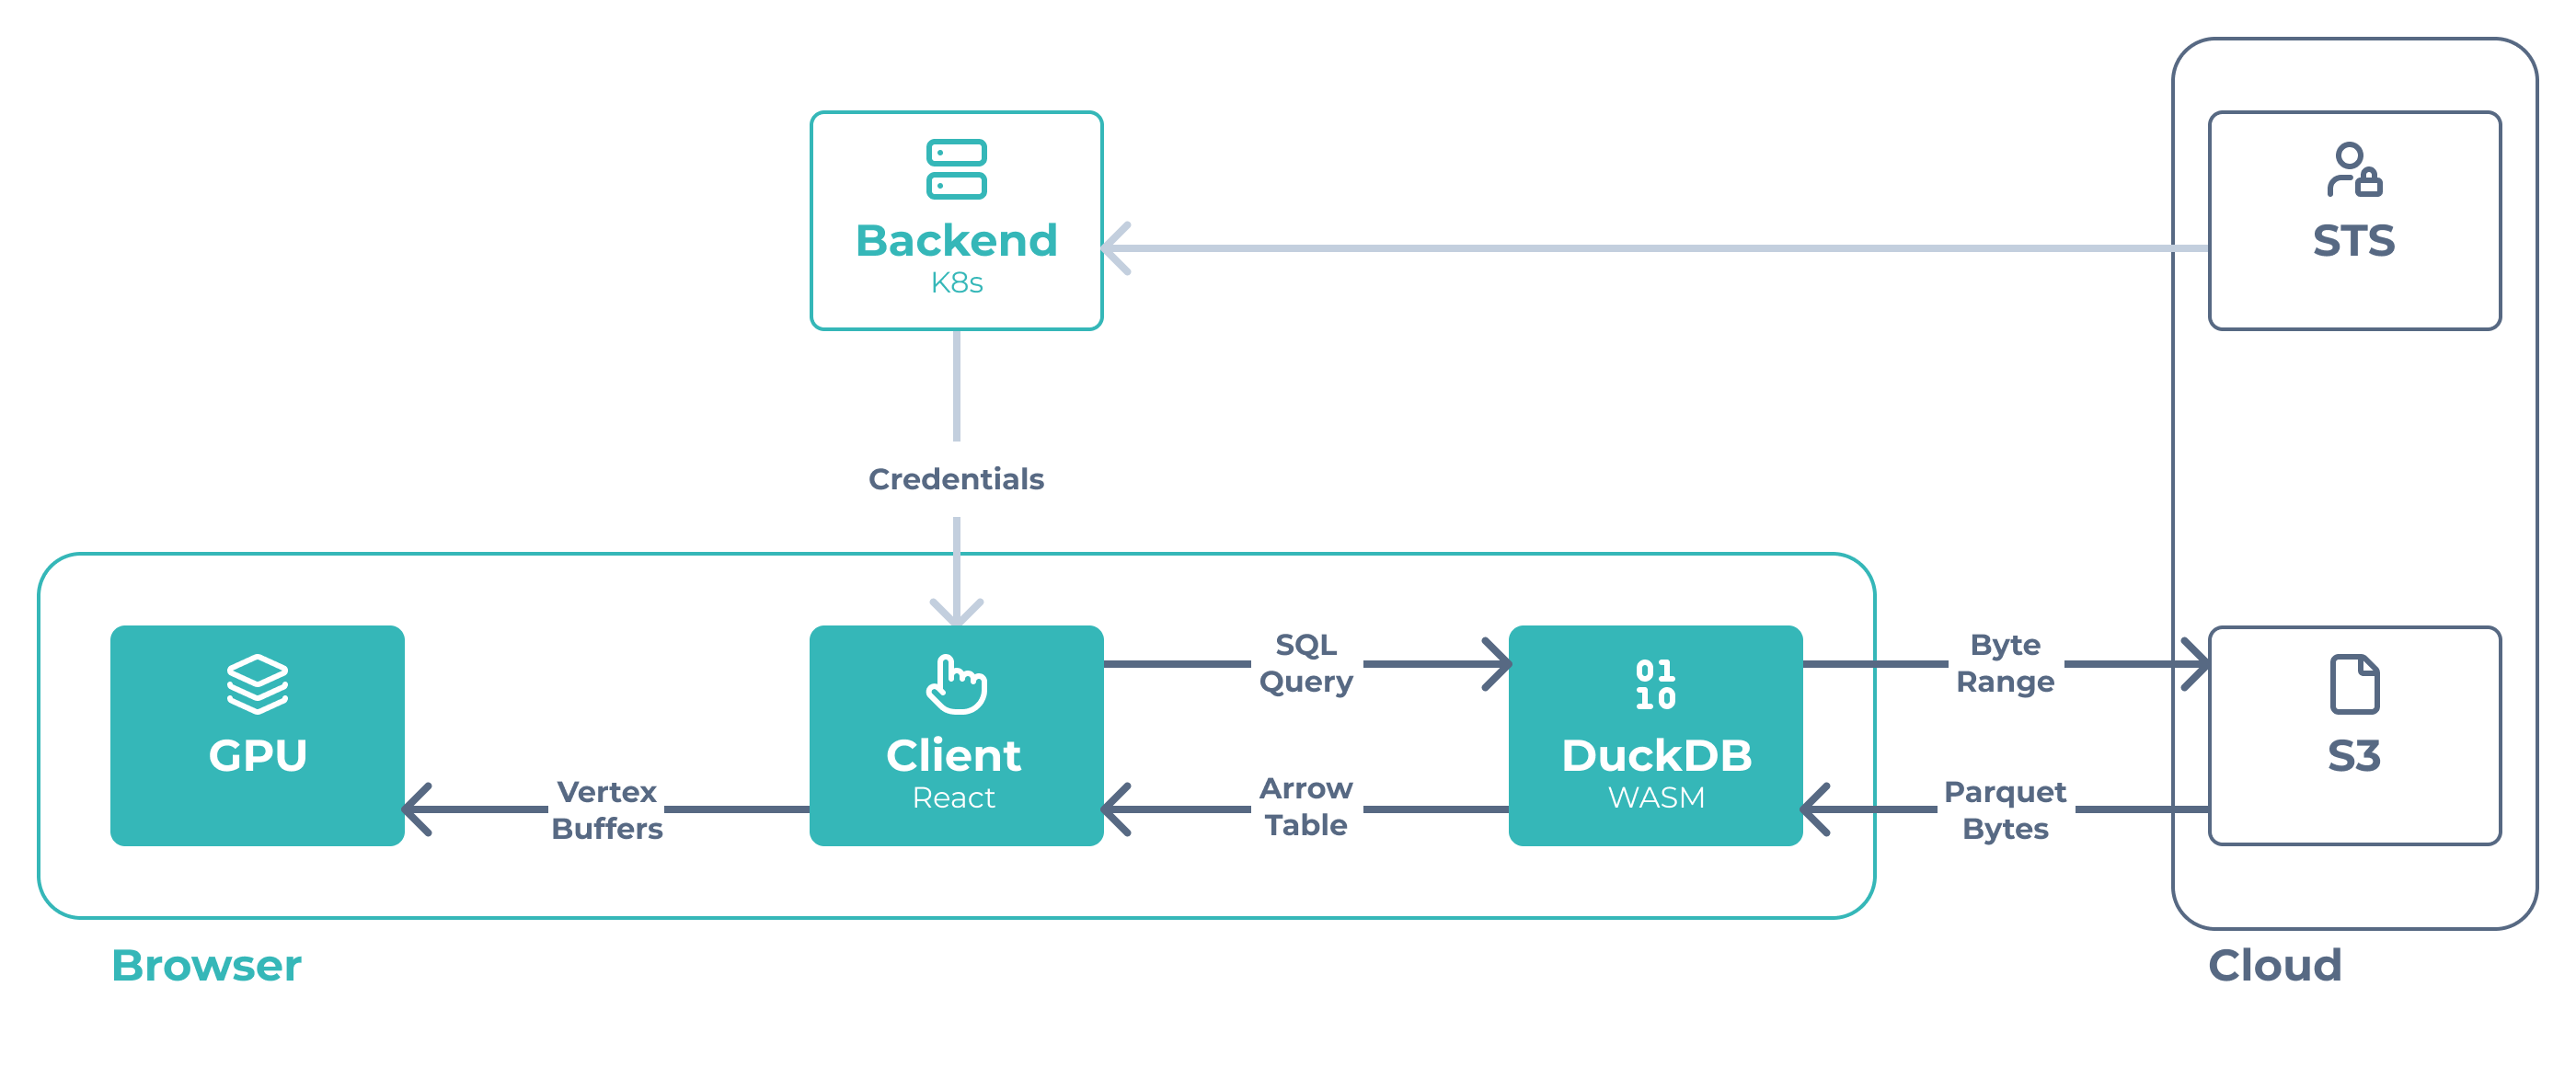
DuckDB fetches only the bytes it needs using HTTP range requests. No tile server, no API calls. Just your browser talking directly to your object storage.
The backend solely serves authentication by issuing temporary AWS credentials so the browser can access S3 securely. Everything else happens client-side.
Performance Profile
The key insight: data fetching is the bottleneck. Once data reaches the GPU, all rendering operations are instant.
What’s Fast?
| Operation | Performance | Why |
|---|---|---|
| Marker toggle | 2-4 ms | GPU uniform buffer update |
| Opacity change | <1 ms | Single float update |
| Tile loading (zoomed in) | Sub-second | Spatial filtering limits data transfer |
| Cached revisit | ~1 s | Browser/DuckDB caching |
What Takes Time?
| Operation | Performance | Why |
|---|---|---|
| First visit | Seconds | ~30MB DuckDB WASM runtime (one-time) |
| Zoomed-out on large datasets | Seconds | Network transfer dominates |
Data transfer is the primary bottleneck, and that is by design. There is no server-side computation limiting throughput, no preprocessing pipeline, no infrastructure to scale. Performance is bounded by network and client hardware, both of which improve over time.
For very large datasets (millions of cells), we are exploring complementary optimizations that preserve the Parquet-first approach: spatial indexing, pre-aggregated overviews, and optimized row group layouts. The core architecture thus remains unchanged.
We have successfully tested our platform with ~600k cells at 60 FPS. Larger datasets are on our roadmap.
GPU Rendering
This is where the architecture pays off. We pack up to 32 markers into a single 32-bit bitmask per cell. The fragment shader decodes the bitmask and performs additive color blending entirely on the GPU—no CPU involvement.
When you toggle a marker, we update a small uniform buffer containing the active marker colors. The GPU re-renders without re-uploading geometry. When you change opacity, we update a single float.
Technical details:
Apache Arrow transfers: DuckDB returns results in Arrow format—binary columnar data that JavaScript can read without parsing. This avoids the overhead of text-based formats like WKT geometry strings.
Bitmask encoding: Boolean marker columns become a 32-bit integer per cell. The GPU shader decodes the bitmask and applies colors for active markers—no CPU filtering needed.
GPU-resident geometry: Cell positions and bitmasks upload once and stay on the GPU. Marker toggles update a tiny uniform buffer. The GPU re-renders without re-uploading data.
Caching: DuckDB caches Parquet metadata. The GPU retains uploaded geometry. Navigating between slides and revisiting tiles avoids redundant network requests.
Tradeoffs
We optimized for the common case—analysis at cellular resolution—while accepting tradeoffs for edge cases:
What we prioritized:
- Real-time interaction during analysis (marker toggling, opacity, panning at medium-high zoom)
- Zero friction for typical workflows (no conversion, standard formats)
- Infrastructure simplicity (no central database, no tile servers)
What we accepted:
- Longer initial loads on large datasets, especially at low zoom levels
The architecture excels where researchers spend most of their time, analyzing cellular neighborhoods at medium-high zoom. We are actively working on optimizations for zoomed-out performance on larger datasets.
Why This Matters for Researchers
Direct data access: Your Python scripts read the same Parquet files the viewer renders. No export, no conversion.
Instant iteration: Run analysis, see results, refine parameters. A workflow that took hours in conversion-heavy systems takes minutes.
Standard formats: Share data with collaborators in universally readable formats. Standard tools like pandas work directly with the files.
No infrastructure headaches: No database server to tune. No tile server to scale. No OOM crashes during data ingestion.
References
- DuckDB-WASM Documentation — The analytical database compiled to WebAssembly that powers client-side queries.
- Apache Arrow Columnar Format — The binary format enabling zero-copy data transfer between DuckDB and JavaScript.
- deck.gl Performance Optimization — The WebGL framework powering GPU-accelerated rendering.
- Gershkovich, “Wearing a Fur Coat in the Summertime” — A critique of monolithic DICOM architecture, advocating for modular, cloud-native approaches in digital pathology.